


2020 Insect Numbers Low in Many Areas of the State
Despite the chaos that 2020 has brought us, the Illinois statewide corn and soybean insect survey was completed this past summer. With the goal of estimating densities of common insect pests in corn and soybean cropping systems throughout the 9 crop reporting districts in Illinois, this is the 9th year the survey has been done (2011, 2013-2020).
Like previous years, 4-5 counties are surveyed in each crop reporting district, with 5 corn and 5 soybean fields sampled in each county. Within the soybean fields surveyed, 100 sweeps were performed on both the exterior of the field (outer 2 rows) and interior (at least 12 rows beyond the field edge) using a 38-cm diameter sweep net. The insects collected in sweep samples were identified and counted to provide an estimate of the number of insects per 100 sweeps (Tables 1 and 2).
Overall, it was a quiet summer in the insect world. Insect populations were low in many areas of the state, but it wasn’t uncommon to find local higher numbers in different regions.
Similar to 2019, western corn rootworm populations remained very low. In addition to sweep samples in soybeans, cornfields were sampled for western corn rootworm by counting the number of beetles on 20 consecutive plants beyond the end rows of a given field—a beetle per plant average was calculated for each field. While populations remained low in several areas of the state, corn rootworm numbers remained higher in northwest Illinois, both in corn and soybeans (Table 3).
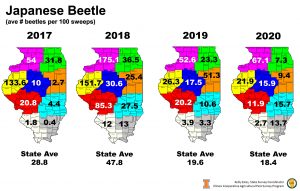
Japanese beetles made headlines in western Illinois during the 2017 and 2018 with record high populations. Fortunately for growers in those areas, surveys in 2019 and 2020 have revealed a dramatic decrease in numbers (Figure 1). In fact, much of the state saw low numbers of Japanese beetles. However, in 2021, we’ll continue to keep an eye out in northwest Illinois as higher numbers were observed in all counties surveyed.
Funding for survey activities was provided by the USDA National Institute of Food and Agriculture. This survey would not be possible without the hard work and contributions of many people, including Cooperative Agriculture Pest Survey Program interns
Table 1. Average number of insects per 100 sweeps on the edge of the field.
| District | Bean Leaf Beetle | Grape Colaspis | Japanese Beetle | Northern CRW | Southern CRW | Western CRW | Grasshopper | Cloverworm/
Loopers |
Stink Bugs | Dectes Stem Borer |
| Northwest | 5.4 | 1.7 | 67.1 | 21.4 | 0.5 | 4.2 | 23.9 | 1.7 | 0.3 | 0.0 |
| Northeast | 18.4 | 0.5 | 7.3 | 3.7 | 0.5 | 1.2 | 8.0 | 1.9 | 0.1 | 0.0 |
| West | 4.4 | 2.8 | 21.9 | 2.1 | 0.5 | 0.0 | 0.3 | 0.6 | 0.3 | 0.7 |
| Central | 42.3 | 9.5 | 15.9 | 2.6 | 0.9 | 0.2 | 12.5 | 1.8 | 0.6 | 0.0 |
| East | 38.0 | 6.9 | 9.4 | 0.1 | 1.0 | 3.0 | 20.2 | 1.4 | 0.1 | 0.0 |
| West Southwest | 2.0 | 15.3 | 11.9 | 0.2 | 4.3 | 1.2 | 6.6 | 0.7 | 0.2 | 0.2 |
| East Southeast | 4.0 | 15.4 | 15.7 | 0.0 | 3.7 | 0.0 | 6.4 | 0.8 | 0.3 | 0.0 |
| Southwest | 0.5 | 6.3 | 13.7 | 0.0 | 1.5 | 0.1 | 8.1 | 0.3 | 0.1 | 0.4 |
| Southeast | 2.8 | 0.5 | 13.7 | 0.0 | 6.9 | 0.0 | 12.0 | 1.6 | 1.4 | 0.4 |
| STATE AVERAGE | 13.1 | 6.6 | 18.4 | 3.4 | 2.2 | 1.1 | 12.0 | 1.2 | 0.4 | 0.2 |
Table 2. Average number of insects per 100 sweeps in the interior of the field.
| District | Bean Leaf Beetle | Grape Colaspis | Japanese Beetle | Northern CRW | Southern CRW | Western CRW | Grasshopper | Clvoerworm/
Looper |
Stink Bugs | Dectes Stem Borer |
| Northwest | 6.2 | 2.4 | 57.2 | 14.5 | 1.4 | 2.6 | 18.4 | 2.2 | 0.3 | 0.0 |
| Northeast | 10.1 | 0.1 | 6.9 | 0.8 | 0.8 | 0.8 | 3.1 | 1.0 | 0.1 | 0.0 |
| West | 6.1 | 0.4 | 16.1 | 1.5 | 0.3 | 0. | 6.4 | 0.9 | 0.5 | 1.3 |
| Central | 39.1 | 6.6 | 16.8 | .1 | 0.7 | 1.0 | 8.3 | 2.1 | 0.2 | 0.0 |
| East | 37.9 | 5.8 | 4.7 | 0.4 | 0.5 | 2.2 | 10.4 | 1.6 | 0.4 | 0.0 |
| West Southwest | 2.2 | 15.0 | 4.4 | 0.8 | 2.7 | 0.1 | 5.7 | 0.9 | 0.1 | 0.4 |
| East Southeast | 4.4 | 19.3 | 15.4 | 0.0 | 3.6 | 0.0 | 6.5 | 0.7 | 0.4 | 0.0 |
| Southwest | 0.9 | 9.5 | 1.2 | 0.9 | 2.9 | 0.3 | 6.0 | 0.6 | 0.0 | 2.4 |
| Southeast | 0.8 | 0.0 | 5.2 | 0.3 | 4.2 | 0.4 | 2.0 | 1.6 | 0.2 | 0.7 |
| STATE AVERAGE | 11.9 | 6.6 | 14.2 | 2.3 | 1.9 | 0.8 | 7.4 | 1.4 | 0.2 | 0.5 |
Table 3. Mean number of western corn rootworm beetles per plant in corn by crop reporting district and year.
| District | 2011 | 2013 | 2014 | 2015 | 2016 | 2017 | 2018 | 2019 | 2020 |
| Northwest | 0.26 | 0.33 | 0.05 | 0.02 | 0.02 | 0.10 | 0.04 | 0.08 | 0.13 |
| Northeast | 0.15 | 0.20 | 0.02 | 0.00 | 0.02 | 1.95 | 0.35 | 0.00 | 0.00 |
| West | 0.01 | 0.10 | 0.01 | 0.01 | 0.00 | 0.75 | 0.00 | 0.00 | 0.00 |
| Central | 0.35 | 0.37 | 0.74 | 0.02 | 0.05 | 0.30 | 0.12 | 0.12 | 0.03 |
| East | 0.31 | 0.81 | 0.51 | 0.01 | 0.01 | 0.40 | 0.02 | 0.12 | 0.05 |
| West-southwest | 0.01 | 0.20 | 0.06 | 0.00 | 0.01 | 0.70 | 0.35 | 0.52 | 0.01 |
| East-southeast | 0.02 | 0.01 | 0.00 | 0.00 | 0.00 | 0.00 | 0.03 | 0.05 | 0.01 |
| Southwest | 0.00 | 0.00 | 0.00 | 0.01 | 0.01 | 0.15 | 0.00 | 0.00 | 0.00 |
| Southeast | 0.00 | 0.03 | 0.01 | 0.00 | 0.02 | 0.20 | 0.03 | 0.00 | 0.00 |
| STATE AVE | 0.12 | 0.23 | 0.16 | 0.01 | 0.01 | 0.51 | 0.11 | 0.01 | 0.03 |