


Midwestern Hemp Database: 2020 Research Report
The Midwestern Hemp Database (MHD) is a large scale collaboration between land grant institutions, private laboratories, non-profit organizations, and grower-cooperators in the Midwest. The goal of this project is to provide regional insight into agronomic performance and cannabinoid development of hemp cultivars grown for cannabinoid production. The data generated from this project is made available through the publicly accessible interface located at: go.illinois.edu/HempDatabase.
The database contains information on production practices (planting method, row spacing, etc.), agronomic performance indicators (flowering date, yield, etc.), and results of the cannabinoid profiling for all cultivars entered into the program. In 2020, over 130 grower-cooperators participated in this project, submitting over 750 samples for cannabinoid profiling. Data collection and sampling protocols have been designed and agreed upon by an team of Midwestern researchers using the USDA rules as a guide. All project information including project applications, updates, and data collection protocols are available at the MHD webpage. A downloadable version of this report is also available here.
Hemp Production Systems
Hemp production systems are quite variable, with growers utilizing many strategies to successfully (or unsuccessfully) grow industrial hemp. Despite this variation, there are a few trends that have emerged with regards to planting and establishment of industrial hemp for cannabinoid production. The following information is shared directly from the MHD results from the 2020 growing season.
Industrial hemp is typically grown on small acreage (<5 acres) and is more akin to specialty crops than traditional row crops. Regional data has shown an increase in number of licensed growers while acreage has decreased indicating a downward shift in average operation size. Farmer ingenuity has led to the implementation of direct seeding strategies, but high cannabinoid hemp is established primarily via transplants from seed (63%) followed by transplants from clones (31%). Low seedling vigor, poor seed quality, and high seed costs across the industry are likely the cause for these trends. Hemp is considered a high input specialty crop and must often be treated like one for success.
Row spacing and target populations are variable and will depend on the cultivar being grown, production strategies used, and equipment available. In most cases, both row spacing and plant spacing are ~4-6 feet to account for optimal plant growth and ease of production operations (cultivation, harvesting, etc.). Corresponding target populations typically range between 1200-2700 plants per acre, but this can be increased or decreased significantly depending on production needs. It is important to understand how hemp genetics (plant architecture and days to maturity) will also interact with these practices.
Hemp Growing Season
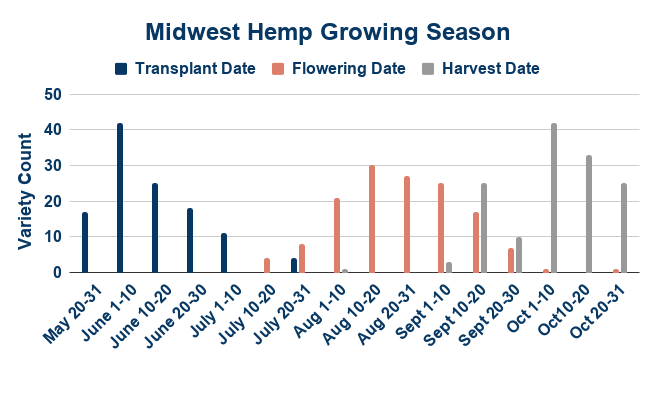
Transplanting of hemp into the field peaks in mid-June but extends into early July. Seedlings/clones are usually established in greenhouse/nurseries for several weeks prior to transplanting into the field. Well-prepared seed beds with good soil tilth will promote uniform growth and development. Hemp does not take well to cold, saturated soils and 65% of all cultivar entries in the MHD were planted into either silt-loam or sandy-loam soils.
Early season weed control is often touted as one of the most limiting factors in hemp production. As there are currently no chemical control options available to hemp, cultural practices will likely be the best tool to combat these early season weeds. Cultural practices such as cover crops, cultivation, plasticulture, and mowing between rows are alternative weed control strategies that will be critical to success. Once hemp is successfully established it is quite a vigorous plant and can outcompete many weeds; however, excessive early season moisture and heavy weed pest pressure can be very challenging to overcome.
Most high cannabinoid hemp grown in the Midwest will begin to flower during the month of August, continuing reproductive growth until harvest in early October. High cannabinoid hemp is traditionally hand harvested for premium floral material, but mechanical methods designed to harvest biomass are also being developed and utilized with varying degrees of success. Production strategies will vary, but growers can use information from the MHD to understand what practices are becoming standard across the region based on their track record of success.
Yield and Growth Characteristics
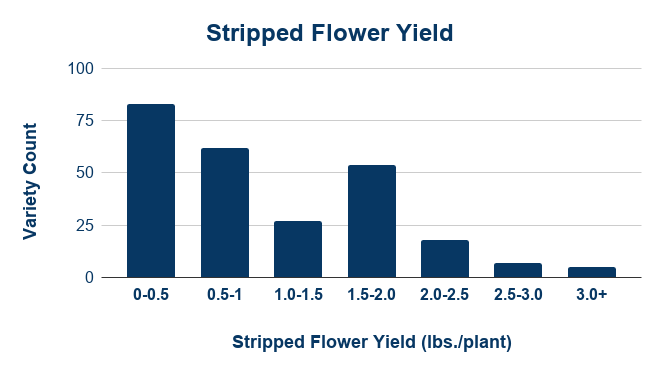
Average stripped floral yield of all varietal entries in the MHD was ~1.22 lbs./plant. Substantial variation existed across the data set, with 140 (54%) of the cultivar entries resulting in yields less than 1.0 lbs./plant. More stringent cultivar trials may be of better use when making yield comparisons of hemp cultivars, but this will serve as a useful benchmark for the time being. Variations in growth characteristics (photoperiod dependent vs day-neutral), cannabinoid of interest (CBD or CBG dominant cultivars), production practices (row spacing, target populations, etc.). Growing experience has not been taken into account for yield metrics and represent an average taken across the whole data set.
Average plant height at maturity for all hemp cultivars was roughly 54 inches. Seeing as most hemp cultivars are photo-period dependent, early planting will result in larger plants prior to flower initiation. While larger plants produce greater biomass and subsequent floral production, they are more susceptible to lodging and wind damage. Large plants can also be difficult to work with, whether hand labor/tools or mechanical equipment are used in harvest and processing Growers looking to maximize plant size may want to consider additional reinforcement (trellis, support poles) to protect plants from environmental stresses that reduce quality.
Day-neutral (autoflower) cultivars will initiate flowering after a set number of days (~70 days to maturity) compared to photoperiod dependent cultivars whose flowering is determined by day length. There is interest in utilizing day-neutral cultivars to stagger production schedules (planting, testing, harvesting, etc.) but more data is needed in this area. Early flowering may correspond with earlier sampling schedules and harvesting dates.
Cannabinoid Sample Timing
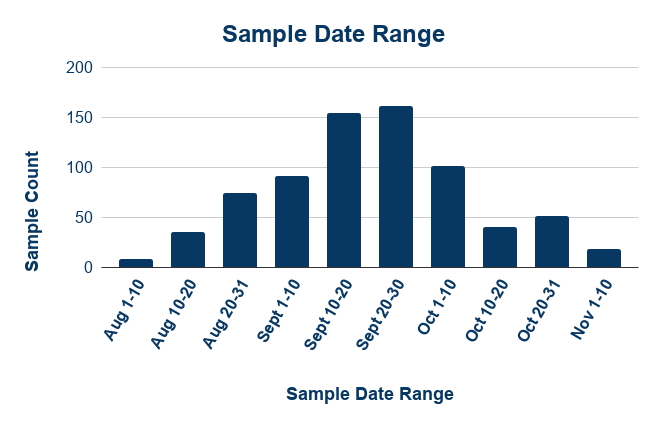
Growers are encouraged to test their crop frequently throughout flowering to ensure compliance regarding THC in anticipation of harvest; however, timing of sampling is of critical importance. As cannabinoids do not begin to develop rapidly until flowering has been initiated, growers are encouraged to delay sampling until after terminal flowering. Terminal flowering is defined as the period at which clusters of female flowers appear at shoot apices at the top of the plant (main cola). Terminal flowers are distinct from sparse, solitary flowers developing in the axils of the leaves (axial flower). The goal of this will be to eliminate unnecessary production costs and/or testing. Sampling for cannabinoids in the Midwest will typically begin in August as flowering begins, increasing in frequency as harvest draws near.
Of all samples submitted into the MHD, 456 (57%) were submitted between September 14th– October 15th. This increase in sample submission corresponds with peak flowering/harvest time in our region. This information suggests there will be a tight peak window during which samples will be collected in anticipation of harvest; sampling requests and sample submissions increase in frequency as growers attempt to maximize production of cannabinoids while maintaining compliance with USDA regulations (<.3% Total THC).
Increases in sample submissions during critical production stages may lead to backlogs and delays in laboratory analysis and reporting. There is currently a great deal of variation across laboratory sample preparation and analytical methods, high performance liquid chromatography (HPLC) and gas chromatography (GC), for example. This disparity between current laboratory procedures makes cannabinoid analyses difficult to compare. As such, submitting samples though an approved, accredited laboratory is recommended to receive the most accurate and useful information for your operation.
Cannabinoid Production
During the flowering period, hemp begins to accumulate cannabinoids in the floral material. Cannabinoids like CBD and CBG determine profit potential while THC determines compliance. 152 distinct cultivar*sources representing 752 samples were entered into the MHD in total. Across this data set there was a great deal of variation across performance metrics. For these reasons, a list of criteria were used to “clean” this data set to provide the most useful information to growers. The data presented in the following text will only contain information from MHD cultivars which have been categorized as “Good Potential.” CBG dominant and CBD dominant cultivars will be evaluated and assessed separately. The list of “good potential” cultivars used in this analysis are available in the pdf version of this report.
Criteria for the “Good Potential” cultivars representing are as follows:
Flowering initiated prior to August 30th
Average stripped floral yield above .5 lbs./plant
Minimum of 5 distinct samples submitted for each source* cultivar within 35 days of harvest
Average Total THC for all samples below .39%
Average Total CBD for all samples above 5% (for CBD Dominant Varieties) or Average Total CBG for all samples above 4% (for CBG Dominant Varieties)
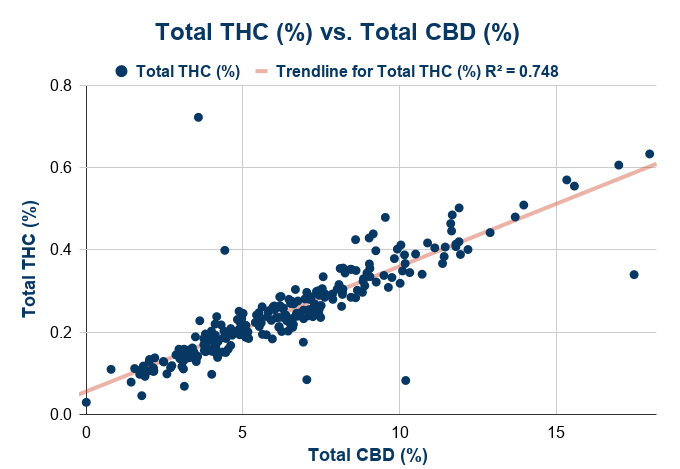
Preliminary data from the MHD shows that many CBD dominant cultivars exhibit a linear (or curvilinear) relationship between Total CBD (%) and Total THC (%). Given this presumed relationship, Total CBD (%) is often not able to exceed ~8% without exceeding the regulatory threshold of 0.3% Total THC. This suggests that cultivars with a stable CBD:THC (between 20-30) throughout flowering will help to maximize profitability while maintaining compliance. The reality is most hemp cultivars currently on the market will go “hot” (>.3% THC) if not monitored appropriately, as 25% of all samples tested were above 0.3% total THC regulatory limit. Growers will be encouraged to test frequently throughout flowering to maximize profitability while maintaining compliance.
Data from 2020 suggests that CBG dominant cultivars contain lower amounts of Total THC (%) compared to CBD dominant counterparts. Across the “Good Potential” data set, average Total THC(%) of CBD dominant cultivars was .24 compared to .09 for CBG dominant cultivars. In addition, CBG dominant cultivars are not exhibiting a quantifiable relationship between Total CBG (%) and Total (THC%) . Thus, growers are not able to accurately or reliably utilize the CBG:THC when making cultivar selections or decisions regarding sampling for CBD dominant cultivars.
This resource is intended as a baseline for growers as we gather more information about cultivar performance. Growers are encouraged to think about how this information may help them in their production endeavors, and what characteristics are desirable for complaint and profitable hemp crops. The Midwestern Hemp Database will be continued, with applications for the 2021 growing season currently open here. For questions regarding the Midwestern Hemp Database, please contact Commercial Agriculture Educator Phillip Alberti at palberti@illinois.edu