


Fertilizing with High-Priced P and K
As the 2022 season winds down, farmers are thinking about their fertility program for the 2023 growing season. While fertilizer prices have declined since spring, fertilizer prices remain high, and fertilizer costs are significantly higher than a year ago (farmdoc daily, 12:148). With continued high fertilizer prices, making every pound of fertilizer count is essential. The most important thing to be as efficient as possible is reviewing a few principles related to soil fertility.
Soil testing
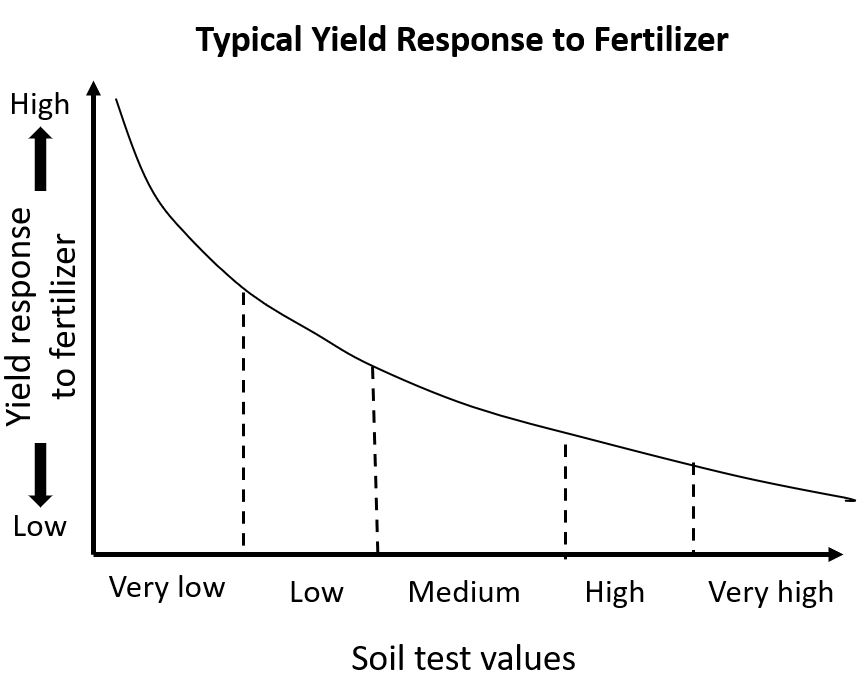
Soil testing is the first step of a good nutrient management program since it provides information to guide accurate fertilizer decisions. The primary purpose of soil testing is to estimate the soil’s ability to supply required nutrients to growing crops. Generally, crops respond more to nutrients supplied as fertilizers at low soil test levels, and less as soil test levels increase; this is shown in Figure 1. Without knowledge of the soil’s ability to supply nutrients, it is impossible to determine which supplemental nutrients – and how much – must be applied to provide for efficient and profitable crop production.
Soil pH affects nutrient availability
Soil pH is a measure of the acidity (pH < 7.0) or alkalinity (pH > 7.0) of soil. In addition to affecting the availability of plant nutrients, pH also regulates the microbial activity and the efficacy of some herbicides, particularly triazines. The pH range for the highest availability of most nutrients is between 6.0 and 7.0 (Figure 8.3, Illinois Agronomy Handbook). While nutrients such as N, K, and S are less affected directly by soil pH, P availability is strongly affected by soil pH. An ideal pH range for most crops and pasture grasses (not including alfalfa or clover) is between 6.0 and 6.5.
P & K
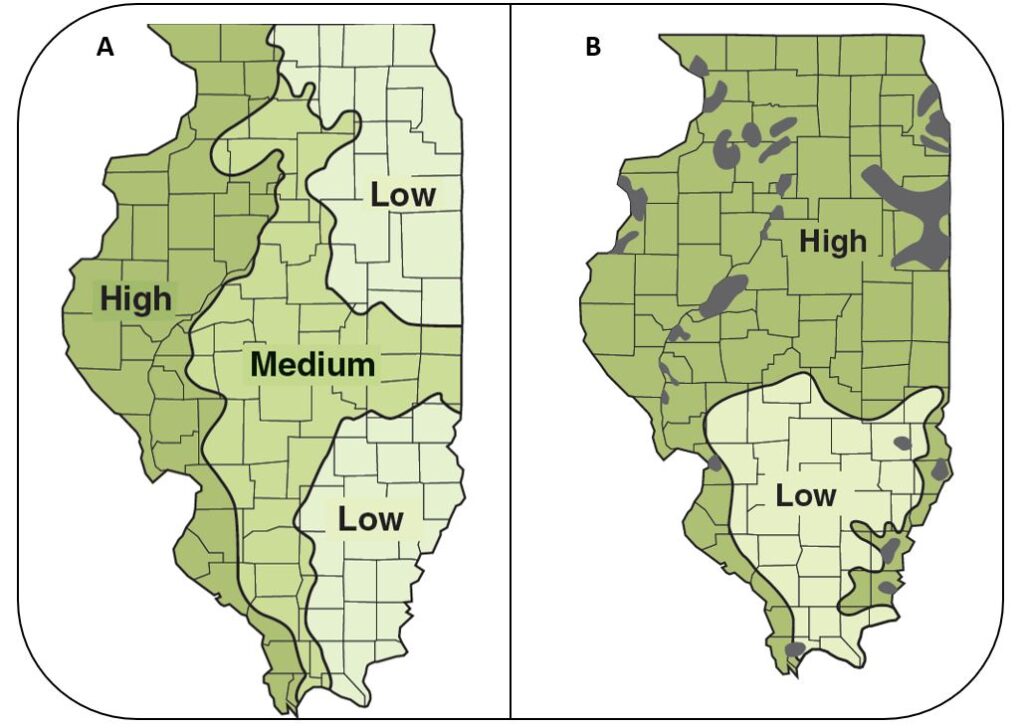
We pay a lot of attention to P and K compared to other essential nutrients because they are required – and removed by the crop – in relatively large amounts, so large amounts need to be applied to prevent deficiency. To ensure that soil P availability will not restrict crop yield, the Illinois Agronomy Handbook recommends that soil test levels be maintained at 40, 45, and 50 pounds per acre for soils in the high, medium, and low P-supplying regions of Illinois, respectively (Figure 2A). There is research-based evidence in the upper Midwest that the probability that P fertilizer is needed for Very High P testing soils is extremely low and unlikely to cover the cost of the application. For instance, soil testing >62 pounds of Bray P1 per acre is considered in the Very High category in Iowa. In Illinois, there is no agronomic advantage in applying P for corn and soybeans when Bray P1 values are higher than 60, 65, and 70 for soils in the high, medium, and low P-supplying regions, respectively. Similarly, No K additions are suggested if test levels are above 360 and 400 lbs per acre for the low and high CEC regions (Figure 2B).
Applying crop removal rates
An alternative to basing applications only on soil test values is to make crop-removal-based P and K applications. This is best done when soil test levels are within the desired range; applying amounts removed by recent crops is designed to keep soil test levels within this range. Crop removal rates for Illinois were updated a few years ago based on several thousand corn and soybean samples collected over three years (2014-2016). Table 1 shows these nutrient removal amounts per bushel. For instance, a 2-year corn-soybean rotation with 200 bushels of corn and 60 bushels of soybean harvested per acre is estimated to have removed 119 lb. P2O5 and 118 lb. K2O per acre. Replacing these nutrients would take 229 pounds of MAP (11-52-0) or 259 pounds of DAP (18-46-0) per acre, and 197 pounds of potash (0-0-60). An article by Emerson Nafziger in 2017 provides more information on the new numbers.

At current prices, 229 lb of MAP costs about $110 and 197 lb of potash costs about $85; together it costs nearly $200 per acre to replace nutrients removed by both crops in our example; or about $100 per year. Corn and soybean prices are high enough to make this easier now than it has been in recent years, and some may even want to apply some extra to fields that didn’t get full removal amounts in previous years.
Be cautious when interpreting soil test K following a dry fall
It is important to be aware that dry conditions when soil sampling can affect soil test K, and to a lesser extent, soil test P. Generally, soil test K levels are lower than expected in a dry fall, and caution is needed when interpreting these results. One of the reasons for low soil test K levels is that dry weather can greatly reduce the amount of plant K recycled into the soil. Tissue K is returned to the soil as rainfall leaches it from plant tissue after plants mature (from standing vegetative plant parts) and from crop residue after harvest. Data from Iowa shows that under normal rainfall between physiological maturity and early December, soybean and corn residue recycled about 100 and 40 lb K2O per acre.