New Grain Phosphorus and Potassium Numbers
Corn and soybean take up relatively large amounts of phosphorus (P) and potassium (K), and much of this P and K ends up in the grain that is taken off the field during harvest. In order to keep soil nutrient levels from dropping over time, the amounts removed need to be replaced by applying fertilizer or manure.
In order to know how much nutrient a crop removes, we need to know how much there is in a bushel of harvested grain. We’ve been using amounts per bushel that are several decades old, and whose origin isn’t clear. There is no indication that these numbers are inaccurate, but newer numbers in other states tend to be lower than the numbers we use in Illinois. It was time to take another look to see if these numbers have changed.
In 2014 Dr. María Villamil and I initiated a survey, funded by the Illinois Nutrient Research and Education Council (which administers fertilizer checkoff funds) to measure P and K levels in corn and soybean grain samples from all regions of Illinois over the three years from 2014 to 2016. With some help from the Illinois Soybean Association and the Illinois Corn Growers Association, and with assistance from a lot of elevators, we collected 2,335 corn and 2,620 soybean grain samples over the three-year period. A commercial lab analyzed nutrient levels in the samples.
In order to see if yield level was related to grain nutrient level in a way that would allow adjustment of the per-bushel nutrient level to the field yield, we gathered estimated yields from the fields from which samples came in 2014, and for some of the 2015 samples. We chose yield level instead of soil type or soil nutrient test level because yield level is far more likely to be known for a field. While we found slight correlations between yield and nutrient level in a few cases, adjusting grain levels based on yield would have made so little difference in the results that using yield level to adjust grain nutrient per bushel was not justified.
Grain P and K numbers in some cases where slightly different from one year to another, and from one region of Illinois to another. But overall, we couldn’t find any consistent effect of location or crop year on nutrient levels. This means that nutrient levels were not clearly tied to anything else about the samples, including where in Illinois the samples came from, which of the three years the samples were collected, or to the yield levels of the fields from which samples were taken.
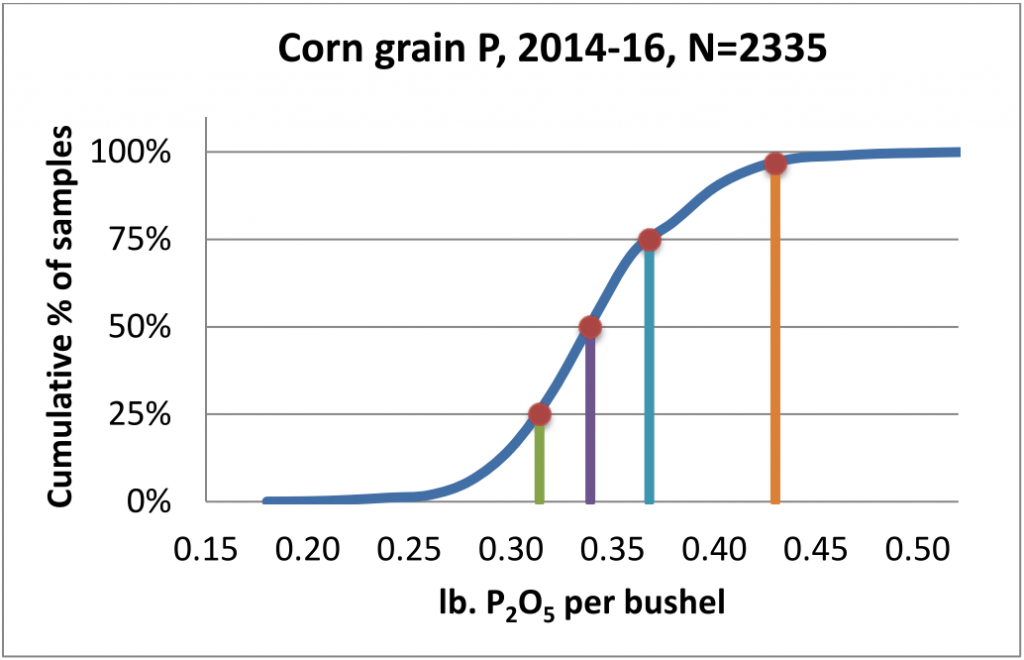
Figure 1 shows the distribution of corn grain P levels among the 2,335 samples that we collected. Values ranged from less than 0.2 lb. P2O5 per bushel to more than three times that amount. While we expected some variability among samples, this variability means uncertainty about nutrient levels in a given load of grain; they could be below, at, or above the average values we found in the survey.
To be on the safe side, we chose the 75th percentile – the point at which three-quarters of the values are below and one-quarter are above – as the new value to use for removal. Figure 2 shows the cumulative distribution of corn grain P values, with the 25th, 50th, and 75th percentile values identified by vertical lines. The number on the right is the “book value” for corn grain P that is currently found in the Illinois Agronomy Handbook. This value (0.43 lb. P2O5 per bushel) exceeds 97 percent of the values we found in the survey. So the older number might not be “wrong” – one could choose it in order to be very sure to cover any possibility for unknown samples. But that would mean overestimating P removal by 6 percent on average, and over years that would add up.


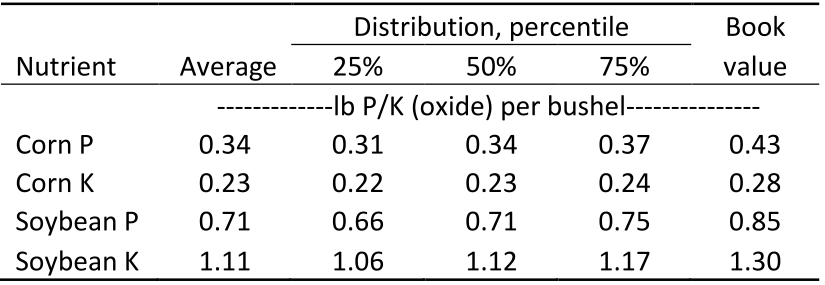
We took this same approach for corn K, soybean P, and soybean K. Table 1 has averages and quartile numbers, as well as “book values” for the other nutrients. Average and 50th percentile (also called the “median”) are not all exactly the same because the distribution is not perfectly uniform, as illustrated in Figure 1. The median is a little better value to use for such things, because extremely low and high values, though rare, affect the average but not the median.

For corn, the new grain removal numbers of 0.37 lb. P2O5 and 0.24 lb. K2O per bushel are both about 15 percent lower than the book values currently in the Illinois Agronomy Handbook. For soybean, the new numbers of 0.75 lb. P2O5 and 1.17 lb. K2O per bushel are 12 and 10 percent lower than the book values, respectively. Because we used the 75th percentile values as the removal numbers, these values are 4 to 8 percent higher than the average or median values; in other words, they’re a little higher than actual removal for a field with average grain nutrient content.
The new numbers we found are very close to those that Iowa State University reported several years ago, after going through a similar exercise and using the 75th percentile values. It’s possible that new numbers are lower than the older values because nutrient levels have dropped as yields have increased. It’s also possible that older numbers were not based on very many samples, or that, in order to make sure that these numbers would never underestimate actual removal, they were chosen as the highest values found.
What seems clear is that improved varieties and management have not led to increases in per-bushel nutrient removal. We did collect some data on hybrids and varieties as part of this study, and will use those to see if there are consistent differences based on genetics. We know from rate studies that adding P or K fertilizer tends to bump up removal rates even when there is no yield response. This could be because roots encounter these nutrients in a concentrated form after fertilization and so take more up without really needing the additional amounts.
How much difference will using the new numbers make? Over two seasons, one with 200-bushel corn and the next with 60-bushel soybeans, P removal using the old book values comes to 137 lb. P2O5 per acre, and using the new values to 119 lb. P2O5 per acre, or 13 percent less P removed. For potassium, the old values calculate to 134 lb. K2O per acre while the new ones calculate to 118 lb. K2O per acre, or 12 percent less.
These are not large changes, but using these replacement numbers instead of the old numbers might mean that soil test values increase slightly less over years. Adding fertilizer in excess of removal is not the only way soil tests can rise; for example, nutrients can be brought up from deeper in the soil to the surface. Soil test levels often rise slowly if at all when nutrients are replaced, though, and lowering the amount used to replace nutrients by 10 percent may have little noticeable effect on soil test levels over time.
This project included wheat grain sampling as well, but we were unable to take many samples in 2014, and so we took some additional samples in 2017 for which we don’t yet have data. The removal numbers for wheat based on 625 samples through 2016 were 0.47 lb. P2O5 per bushel and 0.28 lb. K2O per bushel. The book value for wheat P in the Illinois Agronomy Handbook is 50% higher than actual removal, and after adjusting that number (from 0.90 to 0.60 lb. P2O5 per bushel) the new removal numbers are 22 and 8 percent less than the book values for P and K, respectively. We’ll calculate these again once we have the data from the 2017 wheat samples.


