


The 2025 growing season in Illinois: good but not great
The 2025 growing season in Illinois delivered another storyline characterized by sharp weather contrasts, average crop condition ratings, some disease pressure in places, and very good — if not record-setting — yields in many, but not all, areas. As we have seen before, crops showed their ability to translate good mid-season conditions to good yields even with very dry late-season conditions.
A tale of two springs
March was 4-5 degrees warmer and 2-3 inches drier than normal statewide, bringing optimism for an early start to the planting season. The northern two-thirds of Illinois stayed dry early in the season, allowing widespread mid-April planting across the region. Stand establishments were reported as good to very good, thanks to minimal flooding and soil crusting after planting. By April 13, NASS estimated 1% of corn and 2% of soybeans had been planted; by May 11th, about half of the acreage of both crops was in the ground.
Conditions were the opposite farther south. Spring opened with unusually heavy rainfall across southern Illinois, leading to saturated soils and planting delays in many fields. Many areas received between 6 and 16 inches of rain in April (exceeding 300% of normal in some areas), followed by another 3.5 to 8 inches of rain in May. Despite the delayed start in the south, statewide planting wrapped up near normal, with the last fields planted by the second week of June.
Summer weather and crop conditions
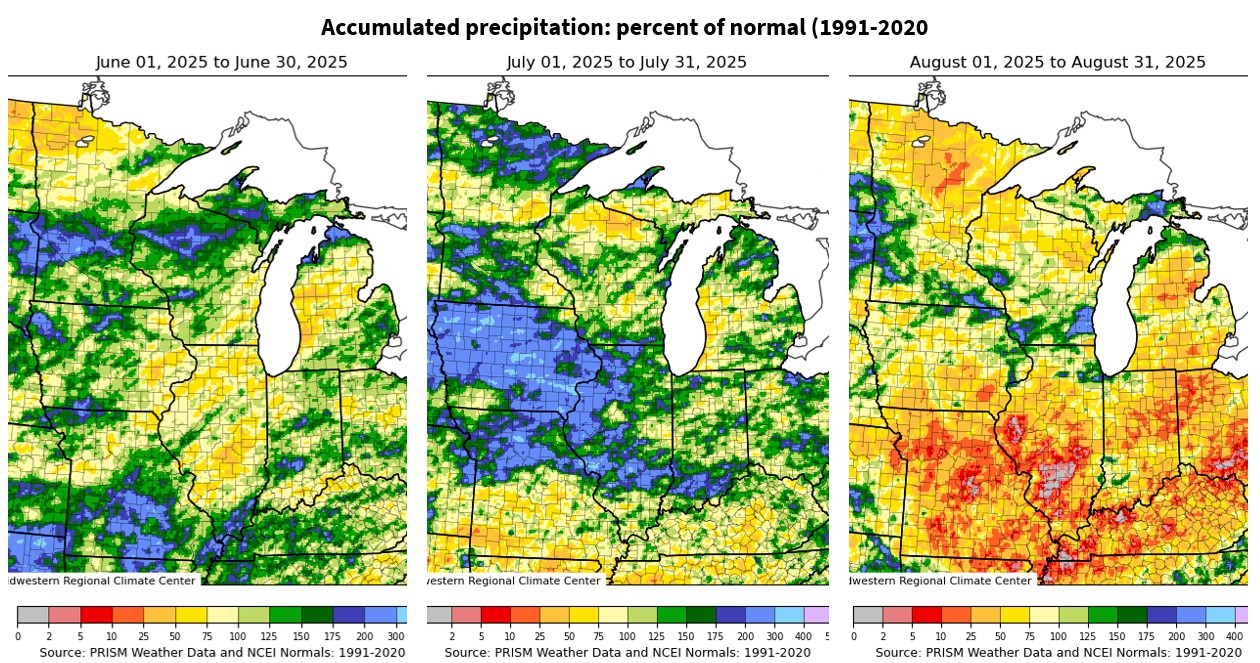
For the fourth year in a row, both crops benefited from a warm, relatively dry June. Without heavy rainfall or saturated soils after planting, stands were generally good in most fields, with good root development, canopy color, and leaf area. Moderate drought conditions developed across northern Illinois by late June, but several rainfall events in July helped relieve it, especially in western, central, and south-central Illinois, where totals reached 200% of normal (more than 8 inches of rain in some areas) (Figure 1). July temperatures also averaged 2 to 6 degrees above normal, and statewide crop condition ratings increased to the typical 65-70% good + excellent by the end of the month.
The warm early-summer weather kept crop development ahead of schedule. Early-planted corn began to pollinate and soybean plants started to flower around June 22. Pollination went well in most fields, although areas that missed some of the July rains (such as Champaign County) showed varying degrees of ear “tip-back”, with kernels at the tip of the cob either not fertilized or aborting after fertilization. Firing—loss of corn leaf area beginning on the lower leaves—began to appear in the driest areas.
Enough soil moisture to carry the crops?
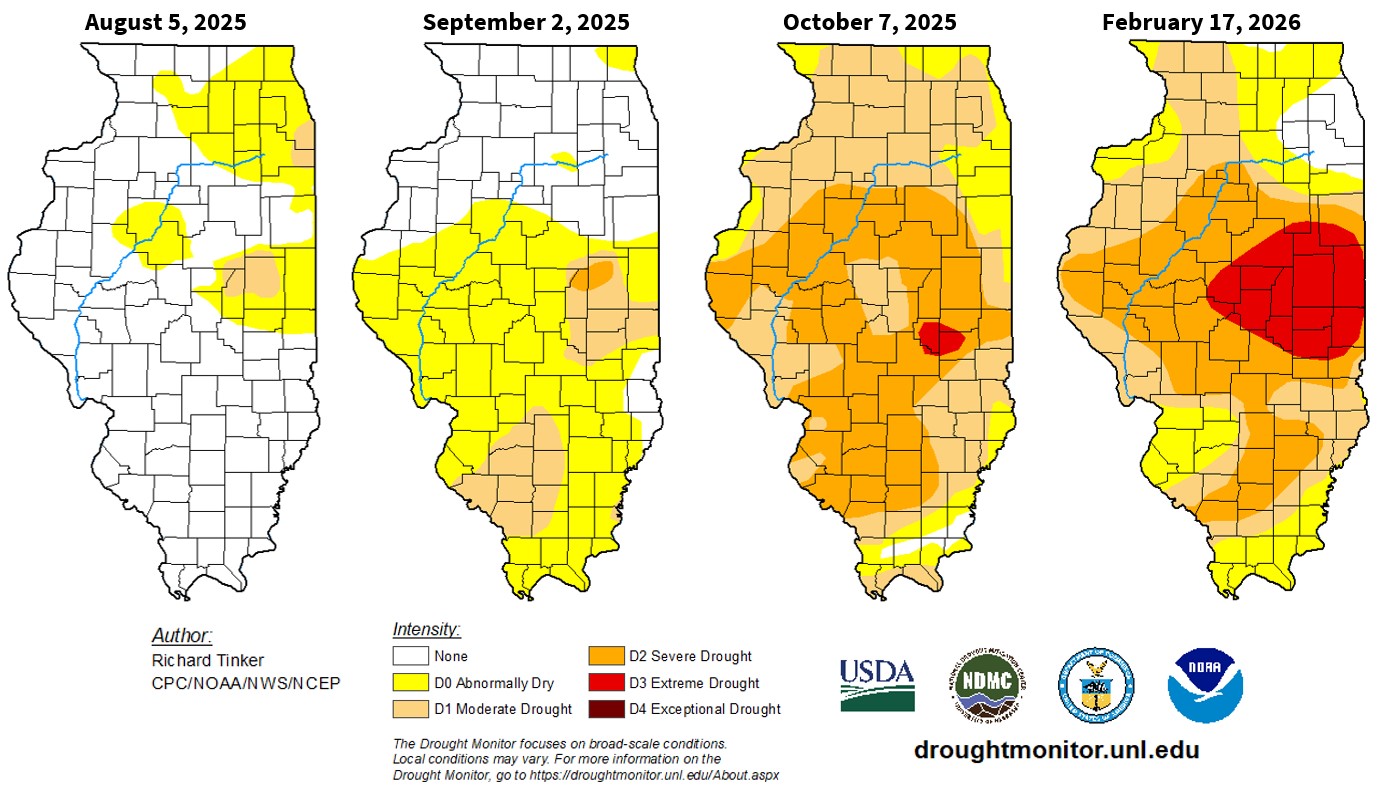
The rainfall tap pretty much closed off over most of the state in August. Parts of southern and south‑central Illinois received little or no rain in August (Figure 1). Parts of east-central Illinois, including Champaign, recorded their driest August since 2013. Drought conditions worsened across central and southern Illinois through September, with only 3.1 inches of statewide rainfall combined in August and September (Figure 2). Crop condition ratings fell to about 55% good + excellent by the end of September, well below any year since 2021.
In each of the last four years, the early August to early September period has been dry or very dry over much of Illinois. Yet yields have been mostly good to very good, including new state records for corn in 2022 (214 bushels per acre) and 2024 (217 bushels per acre). The lesson seems to be that a good first half of the season, with enough dry weather to help establish good root systems, good seed numbers, and good canopy color by mid-July, enables crops to maintain water and nutrient uptake to complete grain fill. Corn fields in dry areas where drought symptoms (especially firing) began to appear during mid-July were unable to maintain productivity, and yields were 20 to 50 bushels lower than expected in such fields.
Early-planted corn began entering R5 (kernel dent stage) in early August, and by August 24, approximately 60% of the corn was dented. Corn typically spends 25 days in the R5 stage (with some variation related to weather and hybrid maturity), needing about 5-6 more inches of water (as much as a quarter inch per day) to reach physiological maturity (black layer). In fields where July rainfall recharged soil moisture, high yields showed that our soils can hold more water than we might expect. Cooler temperatures during the last week of August and into September (2 to 8°F below normal) also reduced crop water use and likely helped stretch soil moisture a little longer. This may not have lowered total water use, but it lowered the daily demand, which helped the roots extract a little more water than if it had been warmer.
Why the high August estimates but lower final yields?
Illinois growers harvested roughly 2.35 billion bushels of corn across 11 million acres in 2025, averaging 214 bushels per acre. Canopy color and leaf area looked excellent heading into seed-filling in August; the August 1 estimates were of 225 bushels per acre for corn and 65 bushels per acre for soybean. Final (January 2026) estimates were 214 bushels per acre for corn (3 bushels less than in 2024) and 62.5 bushels per acre for soybeans (1.5 bushels less than in 2024). Although the federal government shutdown during October and part of November canceled the October 1 yield estimates, the November 1 estimates were for 221 bushels and 65 bushels. Such large drops in estimated yields have typically come as harvest gets underway, not after harvest is nearly complete.
NASS reported a slightly lower number of ears per acre in 2025 than in 2024 (31,400 vs. 31,850), but the bigger factor was likely kernel weight. The very dry August-September period limited the crop’s ability to maintain grain-fill rates, resulting in lighter kernels than normal. Leaf diseases may have contributed to this in parts of northern and western Illinois, where southern rust came in unexpectedly, and where tar spot developed, in some cases long enough after a fungicide application at pollination to limit control.
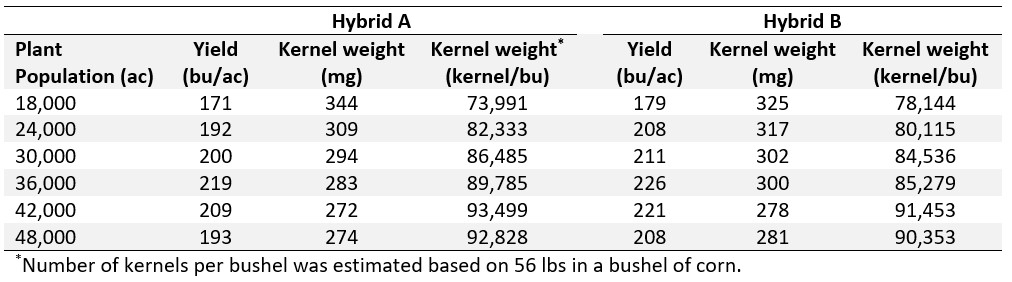
Data from a field trial conducted at the UI Research Center near Monmouth (Warren County) can help illustrate the role of kernel weight. Table 1 shows the estimated kernel weight from two 112-day hybrids grown across a range of plant populations. As expected, kernel weight (mg/kernel) decreased as plant population increased due to greater competition for resources. Both hybrids had the highest yield at 36,000 plants/acre, with estimated kernel counts ranging roughly from 85,000 to 90,000 per bushel. It was a different story than in 2022 and 2024. In those years, drought stress reduced kernel number during pollination in most fields, but good conditions during grain-filling helped the kernels to fill to as much as 70,000–75,000 kernels per bushel in some fields. The opposite occurred in 2025: good kernel numbers per ear but stressful grain-fill conditions that limited kernel weight and maximum yield. Still, 2025 yields matched 2022 yields, and were 3 bushels less than the 2024 record. As a reference, we normally use 80,000 kernels per bushel as the default number when estimating yields during the season. At 80,000 kernels per bushel, 20 million kernels per acre calculates to 250 bushels per acre. That same 20 million kernels would be 286 bushels at 70,000 kernels per bushel, and 222 bushels at 90,000 kernels/bushel.
Illinois growers produced 639.3 million bushels of soybeans from 10.23 million acres in 2025, with an average yield of 62.5 bushels/acre. Approximately 11% of Illinois soybean acres were planted following the harvest of another crop (likely wheat), and double-crop soybean yields may have been lowered by dry conditions in some areas. That likely contributed some to the lowering of the final yield estimate.
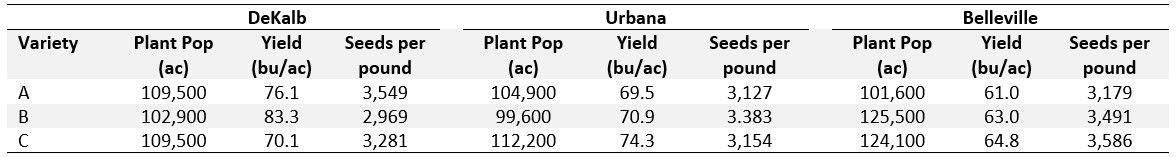
The 2025 soybean story adds some nuance to the familiar saying that “August weather makes the soybean yield”. We need to remember that it was the conditions during the first half of the season, especially July rainfall, that set the yield potential. Warm temperatures in June and July helped, bringing on early flowering (in early-planted fields) and prolonging the podsetting process. With good pod set but limited moisture during seed fill, the soybean crop, like the corn crop, couldn’t pack as much weight into each seed. Data from UI trials in DeKalb, Urbana, and Belleville (Table 2) help illustrate this. Seed size was small across all sites, with counts ranging from about 3,000 to 3,6000 seeds per pound. For context, soybean seed counts usually fall between 2,100 and 3,500 seeds per pound.
What about 2026?
Statewide, total precipitation from October 2025 through January 2026 was less than 7 inches, about 4 inches below normal. Here in Champaign, that total plus the first three weeks of February is less than 4 inches. According to the U.S. Drought Monitor map from last week, nearly 95% of Illinois is currently in some state of dryness: 21% is at D1 – Abnormally Dry; 28% is at D2 – Moderate Drought; 33% is at D3 – Severe Drought; and 13% is at D4 – Extreme Drought (Figure 2). The area designated D4 is an area of drought centered on Champaign County that appeared in early July 2025, increased in severity into last fall, and has expanded in the months since. If the current soil moisture picture stays the same over the next month, we’ll be back to discuss this issue in more detail.