Seeing crops through a wet June in 2026
Despite June temperatures averaging near normal across Illinois, weather conditions shifted dramatically during the second half of the month. The first half of June was very warm, with temperatures ranging from 3 to 10°F above normal. Conditions then turned cooler and much wetter during the second half of the month as multiple rounds of storms moved through Illinois. Total June rainfall ranged from about 2 inches (localized areas in southern Illinois) to more than 10 inches in other parts; up to three times the normal amount for June. In some isolated parts of east-central and northern Illinois, nearly 10 inches of rain fell during a single week in mid-June. The repeated rainfall events left many fields saturated and, in some cases, flooded for several days (Illinois Crop Updates June 12, 19, 26). As a result, crop condition ratings declined during June, with corn and soybean condition ratings each dropping 7 and 9 percentage points between early and late June.
The main question now is how much yield potential was lost under these conditions. Unfortunately, that is difficult to answer with precision. Excess water has certainly caused damage in some fields, particularly in low-lying areas where standing water persisted for a week or more. In those situations, root systems may be damaged to the point that recovery and yield prospects are limited. However, the extent of damage varies greatly depending on the timing and duration of waterlogged conditions.
Research consistently shows that the greatest yield losses occur when flooding or saturated soils affect corn during early vegetative growth stages (before V5-V6, when the growing point is still below ground) and flooding persists for longer periods. In a nutshell, waterlogging reduces root function and oxygen availability, limiting nutrient uptake and plant growth. Yield reductions are often associated with decreases in canopy height, biomass production, and photosynthetic efficiency resulting from damage to leaf chloroplasts. More recently, researchers in Ohio used multiple waterlogging durations (0, 2, 4, and 6 days) and observed yield losses of up to 14 bushels per acre for each additional day of waterlogging when corn was between V4 and V6. Similarly, another study in Missouri with waterlogging of 1, 3, and 7 days reported yield reductions ranging from 6.7 to 11.5 bushels per acre for every additional day of flooding imposed on V6 corn. Yield losses in Illinois this year will depend on how quickly fields drained, how long soils remained saturated, and how well root systems recover in the coming weeks.
It is not easy to predict how wet weather will affect the corn crop, but crop development over the next several weeks should provide us with some clues. While crop growth slows considerably during periods of flooding, one encouraging aspect is that corn often exhibits rapid growth once flooded soils dry and oxygen returns to the root zone. Still, recovery may not always be immediate, especially in younger corn plants with less-developed root systems. In our planting date trial in Urbana, corn planted on April 12 had accumulated ~1,200 growing degree days (GDD) by June 24 and was at the V13-V14 growth stage, behind what might be expected under normal conditions (Figure 1). However, by July 1 (~1370 GDD), plant height had reached approximately 6.5 to 7 feet with good canopy color, and the crop had advanced to the point where the collar of the second-to-last leaf was visible (tassels were visible over the weekend). Corn planted on May 4, May 21, and June 5 each advanced about two leaf stages over that week; also showing good canopy color. Daily high temperature exceeded 90 degrees during the last week of June, nighttime temperatures were 2 to 6 degrees above normal, and plenty of moisture and sunshine promoted good growth rates.
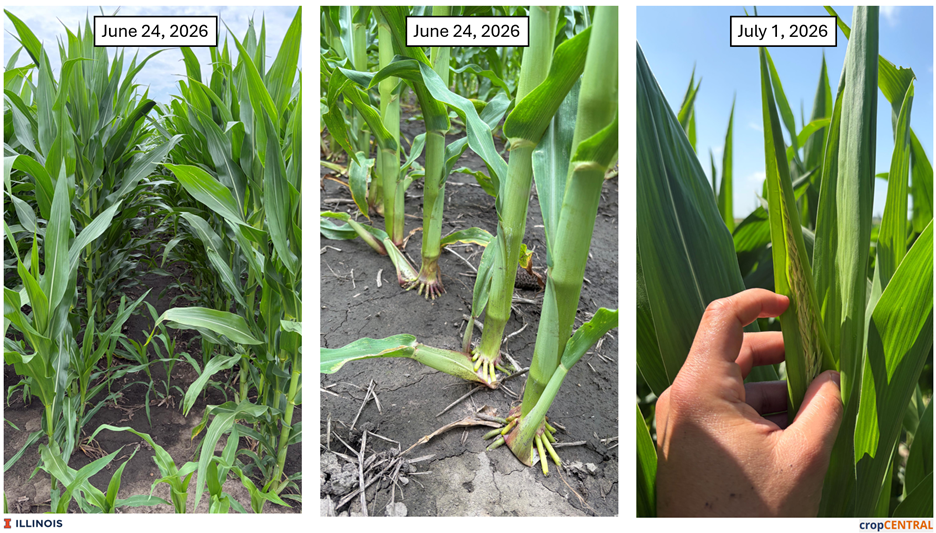
According to the July 6 USDA-NASS crop progress report, corn silking reached 17% statewide, 2% behind this time last year and the five-year average (2021-2025). For fields planted late and affected by prolonged saturation or flooding, however, root recovery remains an important unknown, and it may take a week or so after soils dry and re-aerate before the full extent of root damage becomes apparent. Our hope is that many acres will return to green once soils dry out, since the deep green color of the corn crop indicates that plants are generally well supplied with nitrogen. If crops regain normal color and growth rates as soils dry, that will be a good indication that root recovery is underway. Even so, some yield potential has likely already been lost in flooded areas, especially where plants were larger when flooding began or where saturated conditions persisted for several days.
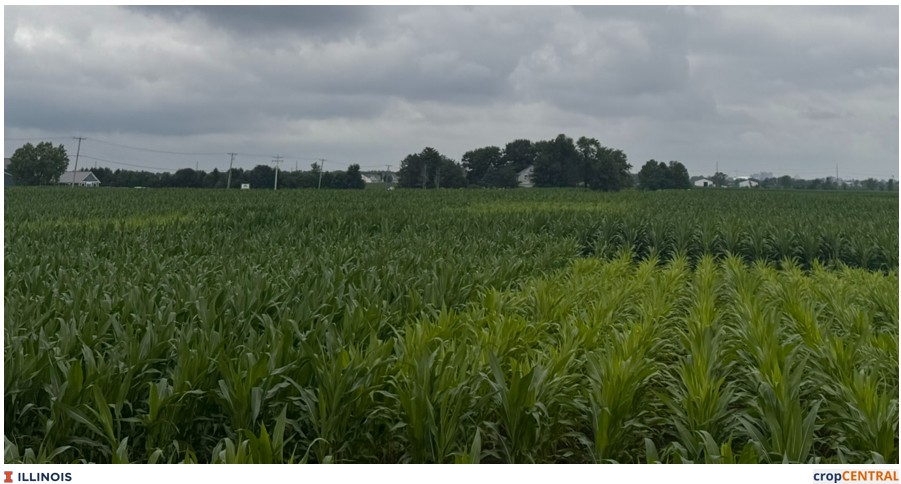
Another, more immediate question is whether the pale green or yellow spots in fields need additional N applied to prevent serious yield loss. The corn crop takes up as much as 6-7 lb of N per acre per day during the rapid growth and N uptake period, from about V9 through tasseling. As a result, canopy color loss can develop quickly when roots are unable to take up enough N. Figure 3 shows the crop canopy from an N rate and timing experiment near Urbana taken on July 6. This poorly drained site has received considerably more rain since planting – evidenced by the severe N deficiencies where low at plant N rates were applied. In many cases, though, the rapid loss of color following flooding is more a result of reduced root activity than the lack of N in the soil. Saturated soils restrict oxygen supply to roots, limiting their ability to take up water and nutrients. We know this because well-drained areas of the same fields are not showing deficiency.
Results from a 2015 N timing study at DeKalb and Urbana illustrate how variable crop response to N timing can be following a wet June. In that year, June rainfall totaled 6.7 inches at DeKalb and about 9 inches at Urbana. At DeKalb, where rainfall returned to near normal in July and August remained relatively dry, applying the full 150 N/acre as UAN at planting produced the same yield (198 bushels per acre) as splitting N applications between planting and either V6 or V9, but delaying N application until VT reduced yields by 13%. In Urbana, where July and August rainfall was closer to normal, the full N rate at planting and a split application between planting and V6 produced similar yields (227-228 bushels per acre), and splitting N between planting and V9 and VT increased yields by 1.5% and 5.1%, respectively.
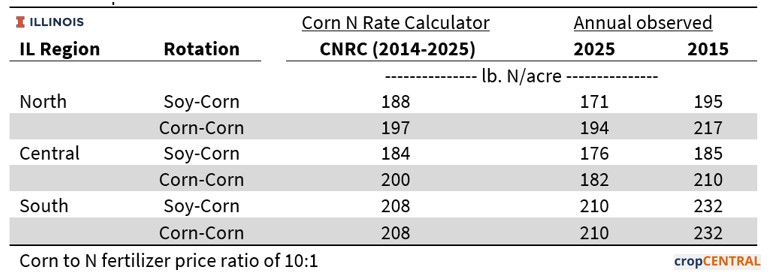
Reflecting on past crop responses to wet early-growing-season conditions, 2015 showed patterns similar to those observed so far in 2026 (Figure 4). Cumulative precipitation data for Monmouth, Urbana, and Effingham indicate that many locations in central and south-central Illinois experienced rapid rainfall accumulation during June, more closely resembling conditions observed in 2015 than in the dry 2025 growing season. This raises the question of whether crop N requirements in 2026 may ultimately resemble those observed in 2015. Table 1 presents data from the current Corn N Rate Calculator and the observed optimum N rates for last year and 2015. In total, many sites showed an increase in fertilizer N requirements in 2015 compared with other years over the past decade. We see that 2015, in contrast to the dry 2025 growing season, had generally higher optimum N rates. Combinations of saturated low-lying areas of fields coupled with N loss events have limited growth and N availability for portions of fields. In these fields, we expect yield increases with high N rates due to the loss of both mineralized organic N and previously applied fertilizer N. Farmers considering rescue N applications should consider that the crop will still respond to N (if deficiencies are pressing and soils are no longer saturated) up to VT, but rarely after.